Solar projects are unique electricity sources, sitting silently and covertly on top of roofs or on tracts of land away from the public eye. Many project owners, from schools to commercial businesses, want to flaunt their obstructed-from-view solar. Inverter manufacturers and installers help them tell the story.
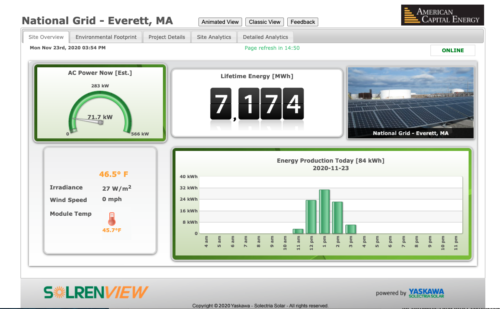
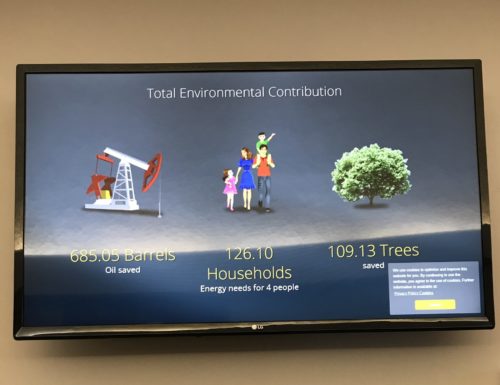
Yaskawa Solectria offers a proprietary monitoring dashboard called SolrenView to commercial customers looking to display a simple dashboard in lobbies or waiting rooms for the public to peruse. The dashboard includes a graph of the day’s energy production, lifetime energy production, module temperature, irradiance and carbon savings information such as tons of CO2 the solar project has offset or number of electric cars it could have charged.
The inverter manufacturer charges a one-time fee for clients to use the dashboard for a number of years. Emily Hwang, applications engineering manager for Yaskawa Solectria, said it’s important for companies and other commercial clients to showcase their solar investments.
“It also encourages other people to think about it, like, ‘Oh, my competitor has solar and a lot of people are talking about how they’re more sustainable than we are. I also want to get on board,'” Hwang said.
She said displaying solar procurement in schools is particularly important to help normalize the clean energy transition.
“It’s really great for our youth to see solar being used, for them to get used to it, for them to feel like this is the way life should be,” Hwang said.
Fronius sees the usefulness of interactive solar exhibits in schools as well, offering its proprietary monitoring platform for display in commercial buildings. Fronius Solar.web can be accessed on the internet or through a smartphone app. The platform includes animations showing the energy flows and real-time statistics on production and consumption.
“A system itself has no moving parts and it’s just static sitting there, but there’s a lot happening in the system, which those visualizations show really nicely,” said Richard Baldinger, head of marketing at Fronius.

The city of Springfield, Illinois, displays production of its municipal utility’s 250-kW solar project on its website for residents to view.
Baldinger said teachers could create lessons based on the data and encourage students to download the app. In engineering classes, teachers could assign problems to students based on the system’s volts and amps, or students could examine return on investment calculations for the solar project in their business programs.
Overall, the most important thing inverter manufacturers can offer is a way for installers and clients alike to show off solar systems.
“Easy, simple to understand monitoring is really a key selling point,” Baldinger said.
Ginlong Solis also offers an application programming interface that lets companies or schools customize their monitoring platform and integrate it into an existing website. Those clients could also display it on a screen for the public to view.
“I have also found that this kind of engagement with the platform invites more scrutiny and interest into how energy is used on site. Supplemented by data from an on-site weather station, and this kind of information can be fascinating,” said Terence Parker, senior applications engineer at Ginlong Solis.
Shifting motivations change strategy
SMA America offered a similar public-facing proprietary solution called Flashview about 10 years ago, but after seeing commercial clients’ motivation for solar shift, it no longer does.

Ameresco donated a kiosk to Westwood Public Schools that displays a variety of information for student engagement with the city’s solar projects, including data about the solar production and carbon offsets.
“Back 10 years ago when commercial building owners or just solar investors in general were getting into the technology, it was because of them being an early adopter and a commitment to the environment,” said Brad Dore, director of marketing for SMA America. “In that case, it was much more important to demonstrate that commitment to the environment, that commitment to reducing carbon emissions.”
Over time as solar became less expensive and more mainstream, Dore said the motivation for commercial solar procurement has turned from environmental support to an economic no-brainer.
“As the argument for solar became so much more financial, the public display became less important,” Dore said.
Dore did preface that the company is based in California, so their local experience may not be the same as others across the country.
SMA now offers Sunny Portal monitoring for all solar segments, which could be displayed on an LCD screen in a building if a customer chooses. It’s not specifically made for the public, but Dore said there are a variety of statistics on the platform that can help people understand what the solar array is doing.
Installers see demand for public display
Massachusetts-based solar installer Ameresco has found every commercial client wants to display its solar investment to the public somehow, said Hans Meyer, director of Ameresco’s Renewable Energy Group. The installer provides that information in an engaging way, especially to its school clients.

Ameresco’s installation for Indiana’s Hamilton Southeastern School district is set back from public view, but the company has partnered with the district to teach students about it.
“Every single customer that we’re working with wants the ability to display something publicly. It may not be necessarily a differentiator, but everyone’s expecting that you have some way to present the data for internal uses within these companies, and external uses,” Meyer said.
Ameresco uses inverter-supplied monitoring like Enphase Envoy for simpler, smaller projects, but it typically uses a combination of data acquisition software solutions to present weather data, consumption info and more for clients to display both internally and publicly. Ameresco then creates custom websites for customers to display on monitors in their buildings.
The company has devised a unique way to make K-12 school solar projects tangible and understandable for students in the form of “solar wagons.” Each wagon consists of a few solar modules hooked up to a battery and an LCD monitor, so students can watch the sun powering the monitor in real time. Schools can opt to own the wagons personalized with the school’s logo and wheeled from class to class to teach children about solar.
“It’s been a really neat, visual way to bring the concept of solar and larger initiatives that our customers have and make it more real for students in classrooms,” Meyer said.
Midwestern commercial and residential installer GRNE Solar has discovered another motivation for project owners to display their solar production — to show accountability to their constituents. Cities that go solar with taxpayer dollars often feel an added imperative to show the energy savings and greenhouse gas avoidance from the public projects. For example, the city of Springfield, Illinois, displays production of its municipal utility’s 250-kW solar project on its website for anyone to view.
“It’s really been more of a new thing where our customers are asking for kiosks or an interactive web page that their clientele or patrons can visit to really see what the energy system is producing and to really get a feel for what either they may be paying for, or what the entity that installed the solar system is paying for,” said Marie Burgquist, director of marketing and manager of business development at GRNE Solar.
She said no matter the reason companies, cities or other commercial solar project owners choose to display their solar production, it’s always good for the industry as a whole.
“We’re in the middle of the shift from the early adopters of solar in the Midwest to more of the mainstream,” Burgquist said. “People are really wanting to start to educate those who may not be even aware that solar is a good option.
“It’s just a great ripple effect that we’re seeing in the industry, and really as a company leaning on our customers and helping our customers really become advocates of solar,” she continued.


My 12.8 kwp DC solar pv system, limited to 10kw AC output, became operational April 1, 2020. I had no idea what output to expect on a month by month basis until I discovered the NREL PVWatts calculator https://pvwatts.nrel.gov/pvwatts.php . The NREL calculator projected that my system would produce about 18 kwh AC in one year, and SolarEdge shows that it has produced 13.6 kwh AC to date. I expect that energy production will be near 17.5 kwh AC at the end of March 2021. A loss of about 0.5 kwh AC to date is likely due to three faulty pv panels and one failed controller, which were replaced about two months after detection. The NREL calculator is ideal for anyone thinking about installing a solar pv system or wanting to know what their existing or future system is capable of. To use the NREL PVWatts calculator, just enter a small amount of required pv system information obtained from your installer or the SolarEdge app.
Correction: In the above post, the last four kwh AC should be mwh AC.
In general, there are quite a few industrial entities who have electronics products that use the tried and true Modbus RTU protocol. Many HMI manufacturers have the same Modbus RTU protocol. It is relatively easy to take a relatively cheap HMI, use tag based programming and display page after page after page of data from one’s system. The ‘other’ thing an HMI can be used for is if and when one gets a smart ESS. You can then talk to your house inverter(s), program the functioning of your ESS and post all of this on data pages for quick operational status on the HMI.
The industry is so explosive in growth right now, there will be several years needed to “shake-out” all of the middle-men wanting to sell you a service for every piece of data in a system. There will be middle-men wanting to “sell” you services for active energy trading using one’s home solar PV + energy storage as an electricity brokerage.